Continuous monitoring for distributed sites.
See every signal from every site on one screen. Set thresholds, get alerts, drill into the moment something went wrong.
Multi-protocol ingestion
REST, MQTT and CoAP for native devices, plus eight edge protocol adapters: Modbus TCP/RTU, OPC-UA, LoRaWAN (TTN / ChirpStack), BACnet/IP, M-Bus, BLE, Zigbee, KNX.
35+ standard sensor definitions
Standard ontology-ready sensor types (BRICK / SAREF / QUDT URIs) with min/max ranges feeding analytics — and a sensor-ontology UI for your own custom types, format patterns and units.
Three layers of alert definitions
Cloud rules (sensor thresholds with operators >, <, ==, ≠), edge rules (CPU / memory / disk on the gateway itself) and camera rules (vision detections with confidence threshold).
Smart offline detection
Probable-cause diagnosis distinguishes battery vs network vs extended-outage failures. Auto-resolves when the device reconnects; suppresses duplicates with cooldowns.
Correlation & anomaly
Z-score and Isolation Forest anomaly detection on every signal, correlation matrix across sensors, 5-sensor overlay compare. Drill into any anomaly with red markers and counts.
Multi-horizon predictions
AI predictions at 1h / 6h / 24h (configurable). Pattern engine recognises cyclical, monotonic, mean-reverting, event-driven and chaotic signals; falls back to local linear regression when needed.
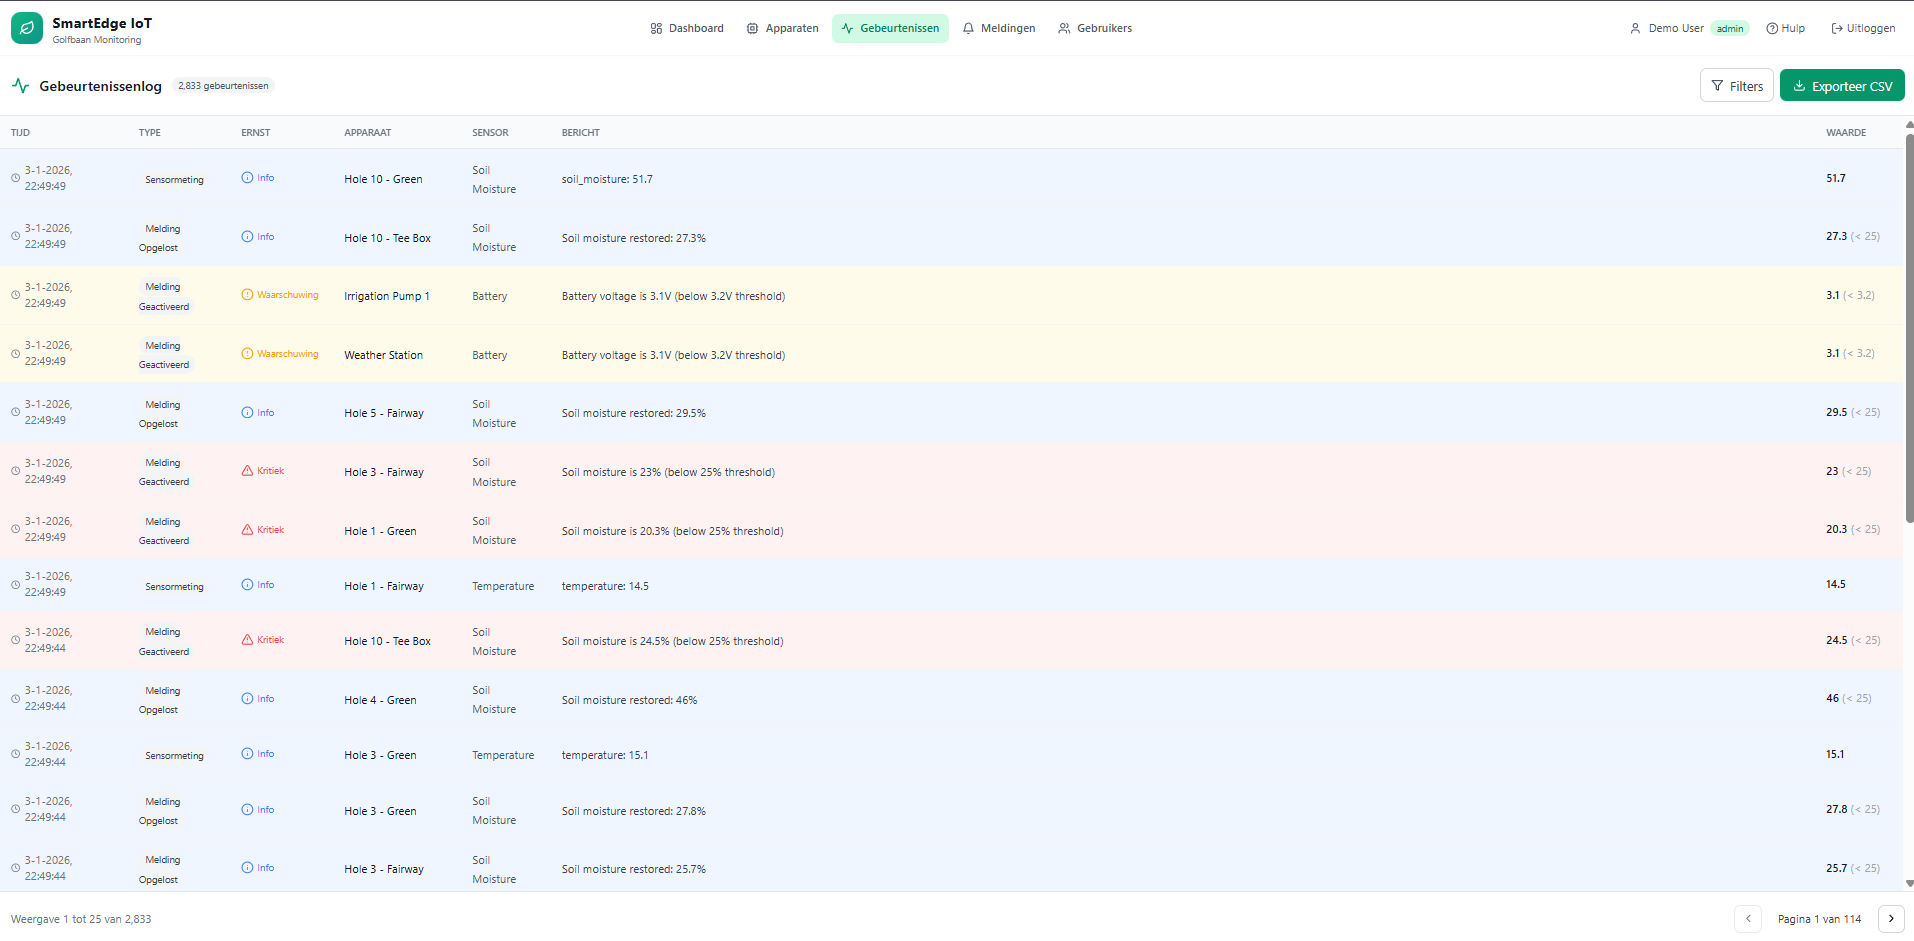
One timeline per site.
Sensor signals, events and operator actions on the same axis. Replay any moment, scrub through 7 days of history, bulk-acknowledge alerts and export to CSV.