Plants, lines and tooling — connected.
Catch a quality drift before the next pallet ships, see why a line stopped, hand over a clean shift summary — without bouncing between four systems.
Quality vision per station
Per-camera inspection models with confidence thresholds, detection-zone polygons and counting lines. Auto-clip events for replay; bulk-export CSV for QA reviews.
Predictive asset health
Any sensor signal (vibration, temperature, acoustic, current draw, …) flows into the same anomaly engine — Z-score and Isolation Forest detection surfaces early failures. Multi-horizon AI predictions (1h / 6h / 24h, configurable) flag drift with R² confidence bands.
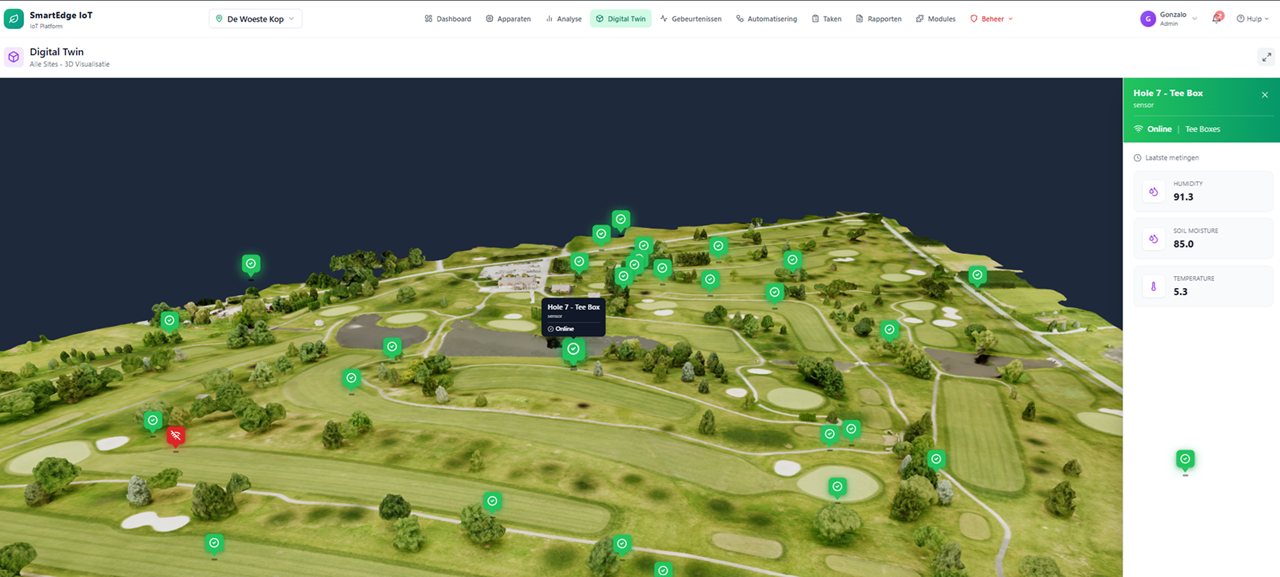
Twin-aware events
Locate every alert in physical space on uploaded .glb/.gltf line layouts. Replay any moment in 3D context with markers carrying live status.
Shift handover & tasking
Kanban or calendar task board with checklists, comments, attachments and AI-driven task creation from briefings. Custom statuses per site.
Hardware-accelerated transcoding
GPU-accelerated camera streams. Live RTSP → browser with quality selector and multi-camera grids.
Correlation & root-cause
Correlation matrix and 5-sensor overlay compare make root-cause obvious — line speed vs vibration vs temperature on the same axis, replay back to first deviation.
Twin-aware operations.
Locate every alert in physical space on uploaded line layouts. Replay any moment in 3D context, with markers carrying live status colours and sparkline mini-charts straight on the scene.